Search This Blog

Showing posts with label global warming. Show all posts

Saturday, October 24, 2015

Congressional science rejectionist Lamar Smith tries to harass scientists for publishing a scientific study

The Texan politician Lamar Smith is a member of the U.S. House of Representatives. He is the current Chairman of the House Committee on Science, Space, and Technology. The Committee has oversight over the National Aeronautics and Space Administration (NASA), the National Oceanic and Atmospheric Administration (NOAA), the Department of Energy, the UnitedStates Environmental Protection Agency, the National Science Foundation, the Federal Aviation Administration, and the National Institute of Standards and Technology.

Lamar Smith is known for rejecting the scientific consensus (Carlton et al., 2015 and references herein), according to which humankind was facing an ongoing climate change (with global warming as one aspect of it) that was caused by human activity. One example of his rejectionist views that come with the usual talking points, combined with elements of conspiracy fantasy can be read here.

According to an article in the Washington Post yesterday, Lamar Smith has issued subpoenas to the Obama Administration for email communications and personal records of the NOAA scientists who published a peer-reviewed scientific study in the renowned journal Science (current impact factor: 33.61) earlier this year. The study, led by Thomas R. Karl and co-authored by eight other scientists, mostly scientists with NOAA, addressed "Possible artifacts of data biases in the recent global surface warming hiatus". In short, the scientific study comes to the conclusion that after eliminating specific, non-climatic influences which had not been considered so far, from the raw data or their analysis (such influences can arise, for instance, from changes in the instruments with which measurements are taken), the resulting time series of the global average of the temperature anomalies does not show the "slowdown" or "hiatus" in the  global mean surface warming compared to the average trend since 1950 anymore, which was diagnosed in the last report of the Intergovernmental Panel on Climate Change (IPCC) for the period 1998-2012. The abstract of the study by Karl et al. states with respect to that:

"Much study has been devoted to the possible causes of an apparent decrease in the upward trend of global surface temperatures since 1998, a phenomenon that has been dubbed the global warming “hiatus.” Here we present an updated global surface temperature analysis that reveals that global trends are higher than reported by the IPCC, especially in recent decades, and that the central estimate for the rate of warming during the first 15 years of the 21st century is at least as great as the last half of the 20th century. These results do not support the notion of a “slowdown” in the increase of global surface temperature."

One has to note here, though, that, contrary to what is often claimed by science rejectionists, the IPCC report did not interpret the diagnosed "slowdown"/"hiatus" as a pause of the physical processes that lead to global warming, or as something that was in contradiction to the current understanding about climate change that has been presented by mainstream climate science, or the projections for future climate change, which have been based on this understanding. Instead, the report presented the "hiatus" as an example for the large interannual and decadal variability in the rate of warming, which can be observed, despite a robust multi-decadal warming:

"Despite the robust multi-decadal warming, there exists substantial interannual to decadal variability in the rate of warming, with several periods exhibiting weaker trends (including the warming hiatus since 1998) (Figure TS.1). The rate of warming over the past 15 years (1998–2012; 0.05 [–0.05 to +0.15] °C per decade) is smaller than the trend since 1951 (1951–2012; 0.12[0.08 to 0.14] °C per decade). Trends for short periods are uncertain and very sensitive to the start and end years. For example, trends for 15-year periods starting in 1995, 1996, and 1997 are 0.13 [0.02 to 0.24] °C per decade, 0.14 [0.03 to 0.24] °C per decade and 0.07 [–0.02 to 0.18] °C per decade, respectively." (Page 37)
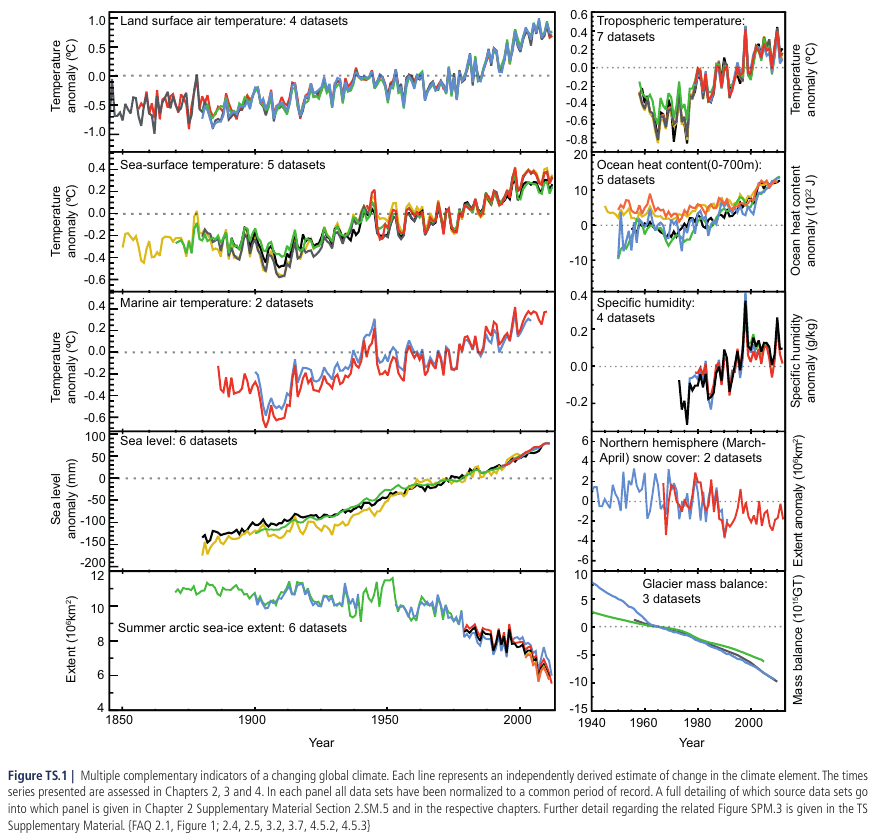
From IPCC (2013), Working Group 1, Page 38

Thus, scientists publish a study based on new or revised data, with results that, if generally acknowledged as valid, revise some results or conclusions that had been presented in previous scientific publications like the IPCC report or individual studies. The normal scientific process is that other scientists examine the data, assumption, and methodology, and they are trying to reproduce the results from the study, if so inclined. If they do not agree with some assumptions or the methodology in the new study, they are trying to do better in their own research. If those scientists obtain different results, they present these results in another scientific study, which then is open to the scrutiny by other scientists again. This is how the scientific process works. Results from previous studies are revised all the time.

However, what is supposed to be the justification for Lamar Smith to open an investigation of the climate scientists who authored the study? The implied suspicion is that the scientists have had committed unethical conduct in their scientific research, which would warrant an investigation. Apparently, no actual initial evidence that would justify such a suspicion has been presented. So it appears, the fact alone that Karl et al. published a study with results contradicting common rejectionists' talking points seems to be considered as sufficient to put the scientists under such a suspicion. This looks very much like a fishing expedition conducted by Lamar Smith, abusing his political power for just another witch hunt against climate scientists. I guess the general purpose of these kind of actions is to intimate scientists by putting them under a permanent threat of retribution for publishing results from their scientific research, which are in contradiction to political, ideological, or religious beliefs of the political right. If they produce such results they can become a target of an investigation by the ones in power at any time, for no real reason. It is another episode in the war on disliked science that has been waged by the U.S. political (far) right in and outside of Congress for years now. This goes very much against the freedom of science.


References:

Carlton, J.S., , and The climate change consensus extends beyond climate scientists, Environ. Res. Lett, 10(9), 094025,  doi:10.1088/1748-9326/10/9/094025.

IPCC, 2013: Climate Change 2013: The Physical Science Basis. Contribution of Working Group I to the Fifth Assessment Report of the Intergovernmental Panel on Climate Change [Stocker, T. F., D. Qin, G.-K. Plattner, M. Tignor, S. K. Allen, J. Boschung, A. Nauels, Y. Xia, V. Bex and P. M. Midgley (eds.)], Cambridge University Press, Cambridge, United Kingdom and New York, 1535 pp., doi:10.1017/CBO9781107415324.

Karl, Thomas R., Anthony Arguez, Boyin Huang, Jay H. Lawrimore, James R. McMahon, Matthew J. Menne, Thomas C.Peterson, Russell S. Vose, and Huai-Min Zhang, 2015: Possible artifacts of data biases in the recent global surface warming hiatus, Science, 348(6264), 1469-1472, doi:10.1126/science.aaa5632.

Smith, Lamar, 23 April 2015: The Climate-Change Religion, Wall Street Journal.

Warrick, Joby, 23 October 2015: Congressional skeptic on global warming demands records from U.S. climate scientists, Washington Post.

Saturday, July 12, 2014

Cold Winter 2013/14 in United States - "Global warming? What global warming?" (Monckton)

The topic probably seems to be out of place a bit for the ones who live in the Northern Hemisphere, considering the current summer weather outside in many places of it. However, I still have seen it popping up as talking point presented by AGW-"skeptics" at various places. The following quote is exemplary:

"The last U.S. winter colder than this one was in 1911/12, before the First World War.
Thank you, America! Most of Britain has had an unusually mild and wet winter, for you have had more than your fair share of the Northern Hemisphere’s cold weather this season.
Global warming? What global warming?"

(Christopher Monckton of Brenchley, March 26, 2014, http://wattsupwiththat.com/2014/03/26/coldest-u-s-winter-in-a-century/)

What global warming? Apparently, it is being suggested that the surface temperatures of the winter 2013/14 were about the same as about 100 years ago, and this would refute global warming. Leaving aside for the moment that it already is scientifically not justified to take the weather pattern of a single season to draw conclusions about the longer-term climate trend, here is the global temperature anomaly and its geographical distribution for the winter (December, January, February) 2013/14 relative to the average winter of the reference period 1951-1980, based on the NASA GISS surface temperature analysis:


Some people may have felt cold in United States during the winter 2013/14. However, the global picture reveals something else. The larger part of the globe had a positive temperature anomaly during this winter compared to the reference period 1951-1980, and the globally averaged temperature anomaly amounted to plus 0.56 deg. C. The temperature anomaly in North America during the high winter season did not even deviate substantially from the average winter temperature of the reference period in a large part of the continent, except for Alaska where it was more than 2 deg. C above the reference period.

Many people in US perceived the winter 2013/14 as cold, because they have not been used any more to an average 20th century winter, due to the warming trend of the recent decades. The following figure shows the geographical distribution of the temperature anomaly for the average winter of the last 20 years compared to the average winter of the reference period 1951-1980:


Now, how does the winter of the year 1911/1912, which was mentioned by Monckton as pretext to deny global warming, looks like in comparison? Here is the geographical distribution of the surface temperature anomaly, again relative to the average winter of the reference period 1951-1980:


It looks very different to the winter 2013/2014. Whereas the winter surface temperatures 2013/2014 in United States were a regional cold anomaly within a generally warmer planet, the surface temperatures of winter 1911/1912 in United States do not stand out compared to the rest of the world. The anomaly is small relative to the reference period again, but large parts of the globe were colder during that winter than the average winter of the reference period. Thus it rather was relatively warmer in the United States than in many other parts of the planet, with respect to the magnitude of the anomaly. The globally averaged temperature anomaly relative to the average winter of 1951-1980 amounts to -0.45 deg. C.

Climate change is a change in the statistical properties of climate variables between different time periods, i.e., a change in the average of a variable (e.g., of temperature, precipitation, sea level, sea ice extend, etc.) or a change in other statistical moments (e.g., variance) of the variable over a time period, which should be sufficiently long. Data from only single years do not allow any conclusions whether climate has changed. This would be just weather, which can be quite variable from one year to the next. Therefore, I am going to show next how the average winter changed from the 29-year period 1881-1910 (it starts with winter 1881/1882 and ends with winter 1909/1910) to the 29-year period 1985-2014:


Here we have the global warming, denied by Monckton. The globally averaged increase in the winter surface temperature is 0.78 deg. C between the two 29-year periods. There has been a general surface temperature increase which is nearly global over the last century, with some regional exceptions. The magnitude of the temperature increase is not globally uniform. The Northern Hemisphere has warmed more than the Southern Hemisphere on average. There is an Arctic amplification, with the surface warming amounting to more than 4 deg. C in some Arctic regions. Land areas have warmed more than ocean areas on average. I have to mention a caveat here. The graphic presentation does not show, where the temperature change between the two time periods is statistically significant. There are likely some regions where it is not.

In short, any claims that the colder winter 2013/2014 in United States refuted global warming taken place over the last century are absolutely baseless.

Friday, January 31, 2014

No "hiatus" (pause/stop) in global ocean warming up to year 2013

Although much of the public focus regarding global warming is on the temperature increase near Earth's surface, the Arctic sea ice decrease, global glacier retreat or other phenomena at the surface, which are more visible to the human eye, from a point of view of physics, the heating up of the oceans is the most important factor regarding the changes in the energy balance of the Earth system. About 90% of the energy accumulation due to the perturbation in the radiative balance at the top of the atmosphere, caused by the increasing greenhouse gases in the atmosphere, is taking place in the oceans[1]. The importance of the oceans arises from their capability to store an enormous amount of heat due to the high specific heat capacity of water combined with the large mass of water in the oceans. To put things in perspective, the heat increase related to warming up only the upper most 3.5 meters of the global ocean body by x degrees is sufficient to warm up the whole mass of the atmosphere by about the same amount of x degrees.

Monitoring the oceans gives crucial information about the ongoing climate change in the Earth system. Following figure shows the global average of the annually averaged temperature anomaly in the oceans between the surface and three different depths, 0-100 meters, 0-700 meters, and 0-2000 meters over time, based on data provided by Ocean Climate Laboratory of the National Oceanic and Atmospheric Administration (NOAA). The figure includes the year 2013 as the most recent data point. The colored shadings show the standard error of the data times two. The black lines display local regression (Loess) fits with the 95% confidence intervals of the fits as grey shadings. The graphic was created using the package ggplot2[2] of the statistical computing and graphics environment R.
 
(Data source: NOAA/NESDIS/NODC Ocean Climate Laboratory,  http://www.nodc.noaa.gov/OC5/3M_HEAT_CONTENT/)

A few things can be see in the figure:

1. The temperature increase, which is visible in the oceans for the average over 100, 700, and 2000 meters depth since the mid 1970s is largest in the upper most 100 meters and becomes smaller with adding deeper layers to the averaging. The perturbation of the energy balance comes from the top and takes decades to penetrate into deeper layers of the oceans.

2. The temperature increase has been nearly linear for the average over the upper most 100 meters depth for the last decades, amounting to about 0.07 Kelvin per decade. To put things in perspective again, the same amount of heat related to this average temperature increase in those 100 meters would increase the average temperature of the whole atmospheric mass by about 2 Kelvin per decade. Luckily for humankind, most of this accumulated heat will not warm up the atmosphere, but penetrate into the deeper layers of the oceans. The exact amount of atmospheric warming in the next decades and centuries will depend on how efficiently heat accumulated in the upper layers of the oceans is being sequestered into the deeper layers of the oceans.

3. Because of this quasi linearity of the temperature increase in the upper most 100 meters, one can conclude that the increase has been accelerating between a depth of 100 and 700 meters. It is not possible to conclude whether an acceleration is present between 700 and 2000 meters depth, since the acceleration seen for the average over 2000 meters depth could come from the acceleration in the layer between 100 and 700 meters.

4. The globally averaged ocean temperature anomaly in the upper most 100 meters shows large interannual variability. The temperature swings can amount to about 0.2 Kelvin within a few years, for example between the years 1998 and 2004.

5. No "hiatus" of the ocean warming is visible in the new century for any of the temperature averages over the various depths. The confidence interval for the upper most 100 meters allows for some lowering of the temperature increase after the year 2005 with a low probability (but equally for some acceleration of the temperature anomaly).

In recent years, the talk has been a lot about the fraction of the energy sequestered into the deep and abyssal layers of the oceans (the so called "missing heat"). In my opinion, there has been some misdirection in the talk about the consequences of this regarding global warming at the surface. The argument has been put forward that concerns about global warming were exaggerated, since the deep oceans interacted with the atmosphere only on long time scales and the heat sequestered into the deep oceans was not coming back to the surface. However, it should be clear from the above that the heat accumulated in the deep oceans is not needed for continuing global warming at the surface and of the lower atmosphere. There is plenty of accumulated heat around in the upper layers of the oceans, which interact with the atmosphere on much shorter time scales, particularly the layers of the oceans which are above the thermocline in the oceans. The amount of heat accumulated in the upper layers of the oceans is more than sufficient for global warming at the surface and in the troposphere to continue for the decades ahead. This heat accumulation has not stopped and it will not stop as long as the amount of greenhouse gases in the atmosphere is increasing unabated due to human activities.

[1] Trenberth, K. E. and Fasullo, J. T. (2013), An apparent hiatus in global warming? Earth's Future. doi: 10.1002/2013EF000165.
[2] Wickham, H. (2009). ggplot2: Elegant graphics for data analysis. Springer New York,  http://had.co.nz/ggplot2/book.

Thursday, January 23, 2014

The story of my visit at Bob Tisdale's blog "Climate Observations"

Bob Tisdale is a little bit a strange fellow. He has a very odd belief that global warming, including the one of the oceans is caused by the El Nino-La Nina (or ENSO - El Nino Southern Oscillation) cycle. El Nino is characterized by a strong ocean heat and sea surface temperature anomaly in the Central and Eastern equatorial Pacific ocean. La Nina is the counterpart, characterized by a negative heat and sea surface temperature anomaly. The equatorial Pacific produces El Ninos and La Ninas every few years, with global reach through the atmospheric circulation, leading to temperature and precipitation anomalies even in remote regions of the planet, mediated through so called teleconnections. Sometimes warm or cold phases occurs in a row only interrupted by neutral conditions. It is a major mode of internal chaotic variability in the ocean-atmosphere system. Bob Tisdale understands as much. However, he does not seem to understand that El Nino-La Nina cannot generate by itself a global ocean warming trend, because the ocean does not heat itself. A net influx of energy into the oceans is needed to cause a secular warming trend of the whole body of ocean water. The energy must come from somewhere. Bob Tisdale cannot explain where it comes from. The axiom here is, like for all the AGW-"skeptics", global (ocean) warming cannot, never ever, be caused by the radiation effect of increasing anthropogenic greenhouse gases. All the arguments are built around this axiom.

This figure (added to the post after original posting) shows the increase in the ocean heat content since 1955, for which needs to be explained what the energy source for all the heating of the   oceans is:

I paid a visit at Bob Tisdale's blog, because I accidentally had seen that he had written and published on his blog an open letter to Daily Show host Jon Stewart who had made fun of AGW-denialism (here and here). After introducing himself, what an important personality he was, in the AGW-denial blogosphere, who even publishes at such an important blog as wattsupwiththat, Bob Tisdale explained to Jon Stewart how utterly wrong established climate science was regarding anthropogenic global warming.

Well, I had had the impression before that Bob Tisdale was someone among the AGW-"skeptics" with whom one at least could talk and who is able to maintain civility, damn was I wrong. What a bully and jerk, filled with delusions of grandeur, and at the same time with the need of getting reassured from his comrades. He very quickly started to show the usual reaction of fake skeptics, when they are losing the argument. He resorted to ad hominem attacks and other evasion tactics. Apparently, when he felt that the lack of physical soundness in his "theory" was pointed out too much and confronted with the inconvenient reality of empirical data, it turned out he is just another one who can't take it when he is being contradicted:
 

Tuesday, September 10, 2013

An independent confirmation of global land warming, not using temperatures from meteorological stations

It has been hypothesized in some scientific publications (e.g., Pielke et al, JGRA, 2007, doi:10.1029/2006JD008229) and sometimes outright asserted (by AGW "skeptics" or in some media outlets; e.g., here, here, and here) that temperature analyses like GISTEMP, HadCRUT, or NCDC were not reliable, and the global warming, seen in these analyses over the last century, using direct temperature measurements from meteorological stations was largely just an artefact of faulty measurements, data adjustments (homogenization), the urban heat island effect, and other factors.

Gilbert P. Compo, Prashant D. Sardeshmukh, Jeffrey S. Whitaker, Philip Brohan, Philip D. Jones, and Chesley McColl have just published a new study (for the abstract: Compo et al., GRL, 2013, doi:10.1002/grl.50425), where the land near surface air temperature is derived using a state-of-the-art data assimilation system (20th Century Reanalysis). The temperature is calculated from other variables (surface pressure) and parameters in the reanalysis. The measured land surface air temperature is not part of the input data. Thus, any possible contamination of the measured land near surface air temperature by other factors than the state of the atmosphere does not have any effect on the land near surface temperatures calculated in the reanalysis system. The correlation between the land near surface temperature, calculated from other variables in the data assimilation system, and the land near surface temperature data series, derived using direct measurements over land is very high. This increases the confidence in that the statistically significant global warming trend of the atmosphere near the surface, seen in the GISTEMP, HadCRUT, or NCDC analyses over the last century is real, and those data sets can be used as reliable references for other scientific analyses.


Wednesday, August 7, 2013

American Geophysical Union's statement on human-induced climate change

The American Geophysical Union (AGU) has revised and reaffirmed its position on climate change caused by human activities, which was adopted for the first time in the year 2003. Position statements like this by the AGU expire after four years, unless it is reaffirmed. I personally agree with this statement. Here, I document the text:

"Human-induced climate change requires urgent action.

Humanity is the major influence on the global climate change observed over the past 50 years. Rapid societal responses can significantly lessen negative outcomes.

'Human activities are changing Earth’s climate. At the global level, atmospheric concentrations of carbon dioxide and other heat-trapping greenhouse gases have increased sharply since the Industrial Revolution. Fossil fuel burning dominates this increase. Human-caused increases in greenhouse gases are responsible for most of the observed global average surface warming of roughly 0.8°C (1.5°F) over the past 140 years. Because natural processes cannot quickly remove some of these gases (notably carbon dioxide) from the atmosphere, our past, present, and future emissions will influence the climate system for millennia.

Extensive, independent observations confirm the reality of global warming. These observations show large-scale increases in air and sea temperatures, sea level, and atmospheric water vapor; they document decreases in the extent of mountain glaciers, snow cover, permafrost, and Arctic sea ice. These changes are broadly consistent with long-understood physics and predictions of how the climate system is expected to respond to human-caused increases in greenhouse gases. The changes are inconsistent with explanations of climate change that rely on known natural influences.

Climate models predict that global temperatures will continue to rise, with the amount of warming primarily determined by the level of emissions. Higher emissions of greenhouse gases will lead to larger warming, and greater risks to society and ecosystems. Some additional warming is unavoidable due to past emissions.

Climate change is not expected to be uniform over space or time. Deforestation, urbanization, and particulate pollution can have complex geographical, seasonal, and longer-term effects on temperature, precipitation, and cloud properties. In addition, human-induced climate change may alter atmospheric circulation, dislocating historical patterns of natural variability and storminess.

In the current climate, weather experienced at a given location or region varies from year to year; in a changing climate, both the nature of that variability and the basic patterns of weather experienced can change, sometimes in counterintuitive ways -- some areas may experience cooling, for instance. This raises no challenge to the reality of human-induced climate change.

Impacts harmful to society, including increased extremes of heat, precipitation, and coastal high water are currently being experienced, and are projected to increase. Other projected outcomes involve threats to public health, water availability, agricultural productivity (particularly in low-latitude developing countries), and coastal infrastructure, though some benefits may be seen at some times and places. Biodiversity loss is expected to accelerate due to both climate change and acidification of the oceans, which is a direct result of increasing carbon dioxide levels.

While important scientific uncertainties remain as to which particular impacts will be experienced where, no uncertainties are known that could make the impacts of climate change inconsequential. Furthermore, surprise outcomes, such as the unexpectedly rapid loss of Arctic summer sea ice, may entail even more dramatic changes than anticipated.

Actions that could diminish the threats posed by climate change to society and ecosystems include substantial emissions cuts to reduce the magnitude of climate change, as well as preparing for changes that are now unavoidable. The community of scientists has responsibilities to improve overall understanding of climate change and its impacts. Improvements will come from pursuing the research needed to understand climate change, working with stakeholders to identify relevant information, and conveying understanding clearly and accurately, both to decision makers and to the general public.'

Adopted by the American Geophysical Union December 2003; Revised and Reaffirmed December 2007, February 2012, August 2013."

Sunday, June 23, 2013

Is there evidence for a statistically significant trend change in the global surface temperature data?

Update: When one starts the trend analysis in 1999, using the the same tools as below, it takes the year 1998 with the strong El Nino out of the picture. Both the year 1999 and 2000 were years with La Nina present. One still gets some weak/medium statistical significance for the difference between the trends from 1975 to present and from 1999 to present.

Just to clarify. This has nothing to do with the denier talking point about a "global warming stop" or similar. Global warming has not stopped as one can see from the continuing increase in the ocean heat content also in recent years (the acceleration in the melting of the Arctic sea ice is another indicator):


Source: http://www.nodc.noaa.gov/OC5/3M_HEAT_CONTENT/

It has more to do with how the additional energy available from the radiative perturbation from increasing greenhouse gases in the atmosphere is redistributed in the Earth system. There may be years, when the fraction of this energy that heats the deeper layers of the oceans increases at the expense of the fraction that heats the atmosphere. This may have been the case in the recent decade, and it could last a few more years. Some recent research supports this possibility (see Meehl et al., Journal of Climate (2013), doi: 10.1175/JCLI-D-12-00548.1).

-----------

Update: I have asked the question below also at Tamino's blog "Open Mind". He gave an interesting answer, pointing me to another post by him, according to which cherry-picking of a start year, which I exactly did by choosing 1998, actually changes the results from the statistical significance test and requires much higher t-values to be exceeded to make the result statistically significant. Keep this in mind, when doing such a thing. I learn something new every day.

----------
Has anyone else noticed that the trend estimates in the data sets for the globally averaged surface temperature anomaly since 1998 have become statistically significantly different from the multi-decadal trend estimates since the mid 1970s? Not yet at the 95% level, but almost, except for the BEST land only data. This is different to the beginning of year 2012. Both the trend estimates and the 2 sigmas since 1998 have come down since then.

I use the Skeptical Science tool (http://www.skepticalscience.com/trend.php), which is based on the methodology according to the Foster and Rahmstorf, IOPS (2011) paper (http://dx.doi.org/10.1088/1748-9326/6/4/044022). For autocorrelation I use 1975 to present (What is the correct choice of the autocorrelation period?)

These are the trends and 2 sigmas in K/decade for the two time periods. The statistical Null-hypothesis is that there has been no change of the trends since 1975.

                    1975-present            1998-present         Significance level
GISTEMP:    0.169+/-0.039           0.057+/-0.14          >85%
NOAA:          0.159+/-0.036           0.033+/-0.131        >90%
HadCRUT4:  0.169+/-0.041          0.038+/-0.149        >90%

For land only data:
BEST:           0.264+/-0.063          0.144+/-0.26            < 1 sigma
NOAA:          0.275+/-0.052          0.101+/-0.205         >90%


This may be all just a statistical artifact due to the cherry picked start year of 1998 and the very strong El Nino in that year, the prevalence of La Ninas in recent years, and the deeper and prolonged solar minimum of cycle 23. The statistical significance may go away again with the adding of the data from coming years. Even a 95% significance level still allows for one false rejection of the Null-hypothesis out of 20. However, with these numbers I do not feel comfortable to reject that some empirical, statistical evidence for a significant trend change toward a lower warming trend in recent years has emerged. Those numbers actually indicate a quite high probability for such a change.

It is not inconsistent with the somewhat smaller increase in the ocean heat content (OHC) in the upper 700 m over the last decade compared to the decades before. http://www.nodc.noaa.gov/OC5/3M_HEAT_CONTENT/

It may be worth to check whether the smaller slope of the 700 m OHC in recent years is statistically significantly different from the slope in the decades before.

Any opinions on those numbers and what conclusions can be drawn from it?

Saturday, June 15, 2013

Declared persona non grata at wattsupwiththat.com

Update, 07/07/2013: See Anthony Watts' comment below and my reply.

-----
I just have tested the new approach, announced in April by Anthony Watts who is host of the blog, to the treatment of comments at wattsupwiththat.com, to see whether anything has changed for me. I commented on an article with the title "No significant warming for 17 years 4 months" by the notorious Christopher Monckton. Well, I tried. This is the result:


Thus, the only change for me is that me being banned is official now. They want to be more among themselves, without being too much interrupted by someone informed rebutting their pseudo-science. It is like with a cult. This is Anthony Watts' big change. I am certainly not the first one who actually works in the field of climate science and who got declared persona non grata over there. I feel honored.

Here is what I had submitted in reply to Monckton's article:

----- snip -----
Anthony Watts seems to think this article posted under the title "No significant warming for 17 years 4 months", written by Christopher Monckton has an important message to deliver to have it put as sticky first post on his blog for a number of days. But with closer examination, it is only the x-th repetition and variation of the "skeptic" talking point about the "global warming stop/pause" or "no warming", observed allegedly for x-number of years (the x varies according to convenience).

Mr. Monckton asserts in his article right away in the first paragraph, that "there has been no global warming statistically distinguishable from zero for getting on for two decades."

Now we are already up from 17 years and 4 months to alleged "two decades", which would make it 20 years, for which there hadn't been any warming that was statistically distinguishable from Zero, according to Mr. Monckton. Why not boldly claim "two decades", if he is at it, right?

On what does Mr. Monckton base his assertion about the alleged lack of warming for > 17 years? He bases this assertion on the fact that the temperature trend in the HadCRUT4 data set does not exceed the 95% statistical significance threshold. As correct this fact is, technically, it's also the point where Mr. Monckton misleads the audience. He equalizes a temperature trend, which does not pass the 95% significance threshold when a statistical test is done with "no warming" at all. And this is just jumping to conclusions.

Let's examine the trend since the start of 1996. There is a tool at the Skeptical Science blog, with which this can be done for the major temperature data sets: http://www.skepticalscience.com/trend.php

HadCRUT4 shows a trend with a 2*sigma (=2*standard deviation, which is equal to about 95% statistical significance threshold) of 0.089+/-0.118 Kelvin/decade. Does this mean this warming is not distinguishable from Zero, generally, because the trend was smaller than 2 sigma? No, it does not necessarily mean that, because it is still possible that the trend exceeds a lower significance threshold.

So, let's check that. The trend of 0.089 in the HadCRUT4 data since the start of 1996 equals to about 1.51*sigma. The 80% threshold of statistical significance is about 1.28*sigma. Thus, even though the 95% threshold has not been exceeded (yet) since the start of 1996, one can distinguish the temperature trend in HadCRUT4 from Zero with more than 80% statistical significance. The probability to err is less than 20%. The other data sets, except for RSS that deviates to the cold side, show similar or higher warming trends since 1996, compared to HadCRUT4 (e.g., Spencer and Christy's UAH data: 0.12+/-0.2 Kelvin/decade). The satellite retrieved data have larger 2 sigma intervals, though. There is a larger interannual variability in the troposphere temperature data compared to the surface temperature data.

BTW: Even if the temperature trend was not statistically significant even at 1 sigma, this would not allow the conclusion that there was "a global warming stop/pause", since non-detectability of a trend in a time series, which is composed of trend and fluctuations is not sufficient to conclude absence of the trend in the time series. This is particularly true in this case, since there is a multi-decadal warming trend going back to the mid 70s, which is statistically significant with more than eight sigma in the surface temperature records.

Another point would be that the atmosphere is one thing, and not the major component regarding global warming. The oceans have continued to warm in the time period during which global warming allegedly has "stopped/paused". About 90% of the additional energy from the radiative perturbation due to increasing greenhouse gases in the atmosphere goes in the ocean. The ocean releases a part of this accumulated energy into the atmosphere over time. This energy release is not a linear process. A large part of this energy is released during El Ninos. And the ice caps at both poles of the planet (that includes the glaciers) have continued to melt. No one should have missed the melting trend of the Arctic sea ice, which has even accelerated over the last decade. These are strong indicators that global warming has continued also in recent years, contrary to what "skeptics" want to make believe.

In summary, Mr. Monckton's assertion of "no warming" for > 17 or even 20 years is false. It does not have any scientific validity, because it is not based on empirical, statistical evidence. And it ignores other indicators for global warming than the tropospheric/surface temperature trends.

Another assertion by Mr. Monckton is about something he calls "Dr. Santer's 17-year test", according to which "models may have failed", because the temperature trend hadn't exceeded the 95% threshold. Now, one could expect that Mr. Monckton provides some proof of source for this assertion about such a test, allegedly stated by Ben Santer. However, the link he provides leads only to another article in this opinion blog here, which was obviously not written by Ben Santer. So, is it the link to the one press release in the other article?
https://www.llnl.gov/news/newsreleases/2011/Nov/NR-11-11-03.html

The press release states something that refers to 17 years. It states:

"In fingerprinting, we analyze longer, multi-decadal temperature records, and we beat down the large year-to-year temperature variability caused by purely natural phenomena (like El NiÃ'±os and La NiÃ'±as). This makes it easier to identify a slowly-emerging signal arising from gradual, human-caused changes in atmospheric levels of greenhouse gases," Santer said.

The LLNL-led research shows that climate models can and do simulate short, 10- to 12-year "hiatus periods" with minimal warming, even when the models are run with historical increases in greenhouse gases and sulfate aerosol particles. They find that tropospheric temperature records must be at least 17 years long to discriminate between internal climate noise and the signal of human-caused changes in the chemical composition of the atmosphere.


The talk in the press release is about the fingerprinting method applied by Santer. Regarding this method, it is said that one needs at least 17 years of observed tropospheric temperature data to detect the human-caused warming signal. However, there is no statement whatsoever in the press release according to which a lack of 95% statistical significance for more than 17 years meant that the model had "failed".

I actually have read Santer et al.'s paper (doi:10.1029/2011JD016263), I suspect, unlike Mr. Monckton. There is nothing in the original paper either that says anything about such a test for model predictions of the kind as asserted by Mr. Monckton. Apparently, Mr. Monckton has just made something up here, regarding the alleged "Dr. Santer's 17-year test" for model predictions using the 95% threshold of significance in the observed data.

Also, I seem to have a different understanding of the English language compared to many "skeptics", because, in my world, "at least" marks a lower boundary, whereas many "skeptics" seem to think that "at least" has equal meaning to "at most".

As for Mr. Monckton's assertion about the alleged IPCC predictions regarding the temperature increase since 2005. Mr. Monckton writes:

It is better to focus on the ever-widening discrepancy between predicted and observed warming rates. The IPCC’s forthcoming Fifth Assessment Report backcasts the interval of 34 models’ global warming projections to 2005, since when the world should have been warming at a rate equivalent to 2.33 Cº/century. Instead, it has been cooling at a rate equivalent to a statistically-insignificant 0.87 Cº/century:

Mr. Monckton asserts here that the IPCC had predicted the temperature would nearly linearly increase by 0.0233 Kelvin/year since 2005, and because the temperature in the real world had behaved differently, the model predictions were wrong. I can't call this claim by Mr. Monckton anything else than absurd nonsense. Mr. Monckton just takes the model ensemble average calculated from many individual model simulations and interprets this as a prediction of how the temperature will behave in the real world. Of course, the ensemble mean does not show the same variability as the temperature in Nature, because it's a mean! Nature only provides one single realization of all possible realizations for the same boundary conditions in a chaotic system. Each individual model simulation is like a single possible realization. It is nowhere predicted by anyone that the one single realization from Nature would follow the model ensemble mean from year to year, or even from decade to decade. A proper comparison, for instance, would be to take the full range of all model simulations, among which, BTW, there are some that actually show a "cooling" over the same time period as well, obtain the 95% range spanned by the model simulations, and then see whether the observed temperature record lies within this range, or marches outside of the range. Mr. Monckton has not done that. According to the real Figure 11.33a in the leaked draft of the AR5 report, the observed global mean surface temperature still lies within the range of the model simulations, although near the lower end.
----- snip -----

Friday, April 12, 2013

What got me snipped from wattsupwiththat.com - 11

Werner Brozek wrote a new article at wattsupwiththat.com about his research on noise in the global temperature record. The reply below to the article, which I submitted to the thread as a comment has not been published there. This is the second one of the couple of comments censored at Anthony Watts' blog, which I announced before to document here. Since I apparently have been blacklisted at Watt's blog by default, currently, I am not going to put any more efforts into trying to comment over there, unless I am not treated differently any more compared to how the ones are treated who agree with Anthony Watts and his friends.

----- snip -----

Werner Brozek wrote:

For example, do we mean that the slope of the temperature-time graph must be 0 or do we mean that there has to be a lack of “significant” warming over a given period? With regards to what a suitable time period is, NOAA says the following:

    ”The simulations rule out (at the 95% level) zero trends for intervals of 15 yr or more, suggesting that an observed absence of warming of this duration is needed to create a discrepancy with the expected present-day warming rate.”

To verify this for yourself, see page 23 here.

And once again the quote from the NOAA report is misrepresented by you. The quote still refers to the ENSO-adjusted temperature record as it has done in the past. However, you omit this information and use it here as if the quote had established some criterion for the unadjusted temperature record. You do so, although you have been pointed out already in the past that the quote applies to ENSO-adjusted data.

Your article does not hold what the headline promises. There is no analysis in there whatsoever that allows any conclusion with respect to whether climate models are "realistic". In order to do such an analysis one would have to do an actual comparison between model capabilities to simulate specific features of the climate system and real world data. Which you haven't done.

You only show some "flat lines" in the temperature record going back different numbers of years, depending on which specific record is chosen, which by itself does not allow any conclusion with respect to the presence or absence of a trend or regarding climate models, since one always will find periods with "flat lines" in any arbitrary time series that is composed of trend and fluctuations, if one chooses the time interval only short enough. One finds similar behaviour in individual simulations with climate models. You confine your examination on those time intervals, where the noise is still masking the long-term trend. This looks to me like a pointless undertaking, unless you want to study the features of the noise.

Models aside, your exercise doesn't even provide evidence for claims like "global warming stopped", or similar. Not being able to detect a trend, because the data set is too small does not allow the conclusion that the trend was not there. None of the seemingly "flat" temperature records, which you show here, can be statistically significantly distinguished from the multi-decadal surface or lower tropospheric warming trend, which itself is statistically significant with 3 sigma or more.

You state:

For this analysis, data was retrieved from SkepticalScience.com. This analysis indicates for how long there has not been significant warming according to their criteria. ... (To the best of my knowledge, SkS uses the same criteria that Phil Jones uses to determine significance.)

This looks to me like another misrepresentation of what others said. Or show me where Phil Jones or anyone at Skeptical Science supposedly claimed that "warming" was significant at 95% or 2 sigma, or there was no significant warming at all. Please provide a source where anyone said something like that, allegedly.

If warming is significant with, for instant higher than 90% probability, but lower than 95% probability, it is still statistically significant. Only the probability to have wrongly rejected the Null-hypothesis (which would be no significance warming in this case) is higher. To claim that there was no "significant warming" in such a case is just wishful thinking.

As for your conclusion:

After looking at the above facts, do you feel that we should spend billions to prevent catastrophic warming? Or do you feel we should take a “wait and see” attitude for a few years to be sure that future warming will be as catastrophic as some claim it will be?

You could have started with that in your posting. Then it would have been clear from the beginning, that your starting point is political and ideological preconception that you apply as a filter for your perception and examinations. That plausibly explains the motivation for your efforts here and for your misrepresentations.


----- snip -----

Wednesday, February 27, 2013

What got me snipped from wattsupwiththat.com - 9

Today, I got (temporarily, I was told. I will see) banished from posting comments on the anthropogenic global warming (AGW) denier blog wattsupwiththat.com. Anthony Watts, weather man and blog host, seems to have got upset (while seemingly projecting his own emotional reaction on me, which made him want to punish me). I apparently have been too critical toward him and his blog. I diagnosed hypocrisy after Watts had made accusations (in a reply at the end of the linked comment) against the hosts of the Skeptical Science blog. They allegedly were "fast and loose with spinning the truth to suit their agenda". The irony is that Watts writes such things below a post on his own blog written by the newspaper journalist and spin-doctor (well, he is not really a doctor of any profession) Christopher Monckton who is known for his notorious AGW denying propaganda and spread of disinformation with respect to empirical climate data and results from research in climate science. And this is only one post in Watts's blog. Disinformation, spin, and propaganda can be found in almost every single article that is posted on the blog.

I challenged Monckton's elaboration here and here with respect to their accuracy and scientific validity. The first comment by me got a reply by Monckton, in which he only repeated previous assertions without anything to back them up, plus some ad hominem arguments against my person. So far, I have not seen anything by Monckton after my second rebuttal to him.

In his announcement to punish me with banning, Watts declared I should not write there anymore, as someone who was funded with money coming from taxpayers. True it is, my whole life is publicly funded, all the expenses that are needed to sustain my lifelihood, everything I do is basically taxpayer funded, since I do not have any significant private income sources, only my salary funded with government grants. Of course, Watts is free to make whatever rules he likes for who is allowed to write on his blog, and no one's rights are violated by this. However, I wonder whether he thinks this should be the case in society generally that people whose incomes come from public funds should not have the same constitutional rights as the ones with income from private sources. And what other rights and entitlements should be limited for publicly funded people compared to privately funded ones, according to Watts.

I am going to see whether my banishment is going to be temporarily. I do not plan to back off from criticizing Watts's and friends's crooked approach toward science and truth on his own blog, from the perspective of someone who works in the field of climate science. If he does not want to have it there he will have to banish me permanently.

Here are the comments that got censored by Watts from the mentioned thread. The first one disputes the meaning of a quote from the NOAA State of the Climate Report 2008 (Attention, this file is 14.9 MB), how it had been presented in a previous comment by another user. The second one just states some facts about the trend of the near surface and lower tropospheric temperature trend over the time period of the last 17 years.

-----  snip -----

Werner Brozek, on February 26, 2013 at 8:42 am, in http://wattsupwiththat.com/2013/02/22/ipcc-railroad-engineer-pachauri-acknowledges-no-warming-for-17-years/#comment-1233141

wrote:

"My purposes are at least two fold. I think it is fairer to say a slope is 0 than to say a slope could be 0 at a certain level of significance, but that it could also be much higher at the higher end."

I don't really understand what "fair" or "fairer" is supposed to mean in the context of assessing data as empirical evidence to support or contradict a scientific statement. What is required in science is to be precise. A statement about a slope of a trend, when it is supposed to be empirical evidence for something, is quite meaningless without any information about the error band of the slope. You can do a trend analysis, and when the result shows a Zero-trend, it is always only a statistical estimate. It does not mean that you really have the information that the trend was exactly Zero. You only have the information that it was Zero within a range of uncertainty for a specified probability. There is no other way here than to make a probability statement. If the statistical significant trend of the temperature increase since the 1970ies lies within the error band of the temperature record of the recent years, then the conclusion that both trends probably did not belong to the same statistical population cannot be validly drawn from such a statistical trend estimate.

If uncertainty ranges did not matter, I could equally claim that the warming trend was something between 1.2 and 4.7 K per decade now, because that's what the trend analysis currently gives as result for all the major data sets from the beginning of the year 2012.

"PDF document @NOAA.gov. For anyone else who wants it, the exact quote from pg 23 is:
”The simulations rule out (at the 95% level) zero trends for intervals of 15 yr or more, suggesting that an observed absence of warming of this duration is needed to create a discrepancy with the expected present-day warming rate.”

http://www1.ncdc.noaa.gov/pub/data/cmb/bams-sotc/climate-assessment-2008-lo-rez.pdf

So I admit that Hadcrut4 does NOT meet this criteria yet, but three other data sets do. See the bolded ones below."

You say everyone who wants can check the quote under the link. However, I wonder whether you yourself have bothered to check whether the quote really says what you assert here it says, because what you bring here is a misrepresentation of its meaning. I already have discussed this quote previously, like here:

http://wattsupwiththat.com/2013/02/01/encouraging-admission-of-lower-climate-sensitivity-by-a-hockey-team-scientist/#comment-1220510

This is the longer version of the quote:

"We can place this apparent lack of warming in the context of natural climate fluctuations other than ENSO using twenty-first century simulations with the HadCM3 climate model (Gordon et al. 2000), which is typical of those used in the recent IPCC report (AR4; Solomon et al. 2007). Ensembles with different modifications to the physical parameters of the model (within known uncertainties) (Collins et al. 2006) are performed for several of the IPCC SRES emissions scenarios (Solomon et al. 2007). Ten of these simulations have a steady long-term rate of warming between 0.15° and 0.25ºC decade–1, close to the expected rate of 0.2ºC decade–1. ENSO-adjusted warming in the three surface temperature datasets over the last 2–25 yr continually lies within the 90% range of all similar-length ENSO-adjusted temperature changes in these simulations (Fig. 2.8b). Near-zero and even negative trends are common for intervals of a decade or less in the simulations, due to the model’s internal climate variability. The simulations rule out (at the 95% level) zero trends for intervals of 15 yr or more, suggesting that an observed absence of warming of this duration is needed to create a discrepancy with the expected present-day warming rate.”
(http://www1.ncdc.noaa.gov/pub/data/cmb/bams-sotc/climate-assessment-2008-lo-rez.pdf, p. 23, Figure 2.8b on page 22 illustrates this graphically).

From the longer version you have only quoted the last sentence. The whole two pages where the quote is from are about the question whether there is a discrepancy between model simulations and observations. The report refers to a study (Collins et al., CD, 2006, doi: 10.1007/s00382-006-0121-0), where many simulations were carried out with one climate model, HadCM3, with varied configurations. The important information you have left out is that the comparison presented in the report is done for the temperature data after adjusting them for the contributions to the temperature series that come from ENSO variability. Therefore, your presentation that the bolded temperature series fulfill this criterion that you quoted is false, since you don't have calculated out those contributions of the temperature variability that come from ENSO.

If you wanted to see whether those temperature data sets fulfill this criterion, you would have to do the ENSO-adjustment exercise first.

Actually, if one really is precise this criterion of "15 years" would only apply to the simulations with the one model, HadCM3, that was used for the mentioned study. The internal variability of different climate models is not all the same. Thus, other models might have given a somewhat different answer, if the study had been performed with those models. Perhaps, the answer for some models, the ones with smaller internal variability, would have been 12 or 14 years, or for other ones, ones with higher internal variability, 17 or maybe 20 years. We don't know the answer for those other models.

----- snip -----

The second censored comment:

----- snip -----
The claim that there had been no temperature rise for 17 year isn't even factually correct, since all the trend estimates for the major data sets show a positive trend, with GISTEMP more than 90% probability of significance, and NOAA and HadCRUT4 with more than 80% probability of significance. The trend estimate for UAH is higher than for these surface data sets, but it is not statistically significant because of the higher variability of the tropospheric temperatures, compared to near surface temperatures. RSS only shows a small positive trend.
----- snip -----

Friday, January 25, 2013

How to create a false "global warming standstill"

  1. One choose a data set of global tropospheric (e.g., UAH, RSS) or surface temperature estimates (e.g., NASA/GISS, NOAA/NCDC, HadCRU), preferably one that has the strongest bias to the cool side.
  2. One finds a time interval in the data set, which is sufficiently short enough so that a statistical trend estimate does not provide any statistically significant warming trend. The large variability within the data on the short time interval makes sure of this. Even better, if the statistical estimate of the trend is close to Zero or negative. In latter case, one can claim "global cooling!" Statistical significance does not matter in this case. It only matters, if it comes to denying a global warming trend.
I have done this exercise for the RSS data of the lower troposphere temperature. And voila! There has not been just one global warming "standstill". There has been even two over the last 34 years, I have discovered using the woodfortrees tool.

According to this, the first "global warming standstill" occurred from 1979 to 1993 (inclusive). The statistical estimate (using this neat trend calculator at the Skeptical Science blog, which is based on [1]) of the trend is 0.012 Kelvin/Decade. The 2-sigma (about 95%) confidence interval is +/-0.229 Kelvin/Decade. As one can see, it is quite large. Then there is the recent "global cooling" from 1997 to today with a trend of (-0.003+/-0.229) Kelvin/Decade. No statistically significant cooling, but what "skeptic" is going to care about that, as long as "cooling" can be claimed.

What about the small interval between the "global warming standstills"? The positive trend estimate in this small time interval is not statistically significantly different from a Zero-trend either: (0.164+/-1.689) Kelvin/Decade. Therefore, since none of the separate time intervals shows any statistically significant global warming, the brave "skeptic" concludes, there has not been any global warming for 34 years at all! It is all a lie, a big global warming hoax! Invented by sinister forces for their own mean purposes.

What now? Now we repeat the statistical trend estimate for the whole time interval from 1979 to today:


The statistical estimate for the trend over the whole time interval is (0.133+/-0.073) Kelvin/Decade. There is a clear global warming trend, which is statistically significantly different from a Zero-trend by more than 3-sigma, which means that the probability to have a false positive signal relative to the noise in the data within the time interval is less than three out of a thousand.

No global warming and presence of global warming cannot be both true at the same time. A statement and its negation cannot be true at the same time. One of the two approaches must be wrong. And it is not the second one.

What does this teach us?
  1. One can get easily fooled by noise, if one chooses too short time intervals of the data in time series analysis. In any time series, once always can find a time interval short enough, for which the noise becomes so large it masks any trend in the data series.
  2. A failure to find a statistically significant trend in a time series does not refute the hypothesis of the presence of such a trend, since one cannot logically exclude the possibility that the lack of statistical significance is only due to a too small sampling size of the data.
  3. Empirical, statistical evidence for a true global warming "standstill" or at least for a trend change could be provided by showing that the trend over the recent shorter time interval is statistically significantly different from the statistically significant warming trend that has been observed over the whole of the recent decades. This is not the case for the RSS data set above (and neither for any of the other mentioned ones). The 2-sigma interval for the RSS temperature data since 1997 is +/-0.229 Kelvin/Decade. The multi-decadal trend from 1979 to today lies well within its boundaries. Therefore, claims about a "global warming standstill", using too short time intervals from these data sets and flawed conclusions from statistical trend analysis, do not have any scientific validity.
[1] Foster, G. and Rahmstorf. S, 2011, Global temperature evolution 1979–2010, Environ. Res. Lett. 6(4), 044022, doi:10.1088/1748-9326/6/4/044022

Tuesday, September 25, 2012

What got me snipped from wattsupwiththat.com - 3

"The reason is that WUWT does not censor comments like alarmist blogs do. It allows true freedom of speech, thus the grain of truth is winnowed from the chaff of propaganda; readers can make up their own minds, and arrive at reasonable conclusions based on the facts presented."
(Smokey aka David B. Stealey, moderator of the blog wattsupwiththat.com, http://wattsupwiththat.com/2011/09/28/comment-of-the-week-2/#comment-754850)

I continue my series that documents comments that are apparently not liked, and therefore vanished at the opinion blog wattsupwiththat.com, which is presented by blog host Anthony Watts as "The world's most viewed site on global warming and climate change" and which promotes denial of anthropogenically caused global warming. The comment was in reply to the claim by regular guest author Bob Tisdale, made in his posting "Tisdale asks: Hey, Where'd The El Niño Go?". Mr. Tisdale asserts global warming was caused by the natural phenomenon El Niño.  The El Niño/La Niña pattern (or ENSO - El Niño/Southern Oscillation) is a major mode of ocean variability in the tropical Pacific. It influences the weather in many parts of the world through so called teleconnections. Here is my comment to this claim. The comment also included a couple of questions for Mr. Tisdale:

----- snip -----
How is El Nino supposed to cause global warming? El Nino/La Nina is a major mode of natural variability with warm and cold phases, but global warming is a long-term trend. And the temperature of the upper ocean layers is not an independent climate driver. It's a dependent variable, so it can be the first cause that explains global warming. Claiming a warming of the upper ocean layers was the cause of global warming is just circular reasoning, since warming of the upper ocean layers is part of global warming.

Here are the annually and globally averaged anomalies of the surface temperature according to the GISS analysis relative to the average of the reference period 1951-1980:

For the decade of 1991 to 2000:
0.36, 0.14, 0.15, 0.25, 0.4, 0.3, 0.42, 0.59, 0.34, 0.36; mean+/-std = 0.331+/-0.133
For the decade of 2001 to 2010:
0.49, 0.58, 0.57, 0.49, 0.62, 0.56, 0.59, 0.44, 0.57, 0.63; mean+/-std = 0.554+/-0.061
(http://data.giss.nasa.gov/gistemp/graphs_v3/Fig.A2.txt)

What El Nino events are supposed to have caused and how are they supposed to have caused it that the 10 year average of the global temperature anomaly of the period 2001 to 2010 was 0.22 K higher than the 10-year average of the period 1991 to 2000? How does El Nino cause the long-term increase in the ocean heat content?

----- snip -----

Update 09/25/2012, at 9:27 AM:  The statement above, "It's a dependent variable, so it can be the first cause that explains global warming", was supposed to say "It's a dependent variable, so it can't be the first cause that explains global warming" (h/t Al. Thank you for spotting this and notifying me). Comments still don't work.

Update 09/25/2012, at 9:32 AM: Posting new comments actually works. Old comments have not been imported yet.


Thursday, August 23, 2012

Has global warming stopped? - An examination of a fake skeptic's argument

I'm documenting here my reply I gave somewhere else to a couple of talking points that are frequently used in the fake skeptic universe. One talking point is that global warming had allegedly stopped, based on the fact that statistical significance of the temperature trend on some short time scales like 10 years has been missing. The second one is the assertion that the observed temperature trend was in contradiction to the carbon dioxide change over time. Both are common straw man arguments applied to create doubt toward the results from research in climate science that there was a global warming trend which can be distinguished from noise due to natural variability, and that an increase in the mass of carbon dioxide gas in the atmosphere causes global warming.

Fake skeptic statements are in italic.

----- snip -----
A clear example of this falsehood has been debated in this thread. It is a fact that there has been no statistically discernible rise in global temperature over the last 10 years. However, there was statistically discernible rise in global temperature over each of the three previous 10-year periods. Clearly, the statistically discernible rise in global temperature in each decade from 1970 to 2000 has stopped while, importantly, the rise in atmospheric CO2 has not stopped.

So, we have had arguments on this thread concerning whether a 10-year period is – or is not – meaningful. Clearly, in this case it is meaningful: i.e. it means the observable global warming since 1970 has stopped. This is an incontrovertible conclusion.

Let me repeat with my own words. The speaker asserts that each 10-year period from 1970 to 2000 showed a statistically significant warming. He also asserts, the absence of a statistically significant warming in the decade after 2000 implies the conclusion there hadn't been any global warming after the year 2000, in contrast to the previous 10-year periods. This conclusion was incontrovertible.

Now let's check the facts and then let's examine the conclusion.

First the trends for each 10-period with their 2-sigma significance threshold. I use the trend calculator at the Skeptical Science Blog: http://www.skepticalscience.com/trend.php

I split the 10-year periods as follows: 1971-1980, 1981-1990, 1991-2000, 2001-2010

Trends in K/decade.

1971-1980:

GISTEMP:   0.144+/-0.330
NOAA:      0.152+/-0.333
HADCRUT3v: 0.134+/-0.389
HADCRUT4:  0.16+/-0.359

None of the trends in the four data sets is statistically significant at 95% probability or above over the 10-year period 1971-1980.

1981-1990:

GISTEMP:   0.091+/-0.345
NOAA:      0.100+/-0.290
HADCRUT3v: 0.084+/-0.301
HADCRUT4:  0.082+/-0.291
RSS:       0.046+/-0.502
UAH:       0.058+/-0.531

None of the trends in the six data sets is statistically significant at 95% probability or above over the 10-year period 1981-1990.

1991-2000:

GISTEMP:   0.298+/-0.381
NOAA:      0.314+/-0.338
HADCRUT3v: 0.356+/-0.382
HADCRUT4:   0.301+/-0.356
RSS:        0.447+/-0.594
UAH:        0.367+/-0.640

None of the trends in the six data sets is statistically significant at 95% probability or above over the 10-year period 1991-2000.

2001-2010:

GISTEMP:   0.019+/-0.277
NOAA:      -0.021+/-0.244
HADCRUT3v: -0.069+/-0.234
HADCRUT4:   -0.012+/-0.249
RSS:        -0.161+/-0.376
UAH:         -0.065+/-0.410

None of the trends in the six data sets is statistically significant at 95% probability or above over the 10-year period 2001-2010.

So, in none of the consecutive decades 1971-1980, 1981-1990, 1991-2000, 2001-2010 had there been a statistically significant warming trend with a probability of 95% or above. According to the "logic" of the speaker, the absence of a statistically discernible warming trend implies that global warming "has stopped". Thus, no global warming at all for four decades.

Now let's do the trend analysis for all 4 decades together:

1971-2010:

GISTEMP:   0.169+/-0.038
NOAA:      0.168+/-0.035
HADCRUT3v: 0.165+/-0.038
HADCRUT4:  0.177+/-0.036

Now we get a statistically significant trend with a probability of at least 95% for all four data sets from 1971 to 2010, although, according to the "logic" of the speaker, the absence of global warming in each of the four decades was "incontrovertible" due to the absence of a statistically discernible trend in each of the four decades.

Global warming present and global warming absent. Both can't be true at the same time. It appears to be a conundrum. But it is none. the speaker has just applied the same logically fallacious argument again, which had been applied by him before. The logical fallacy is to draw the conclusion that a trend was absent in a data set from the fact that a trend was not detectable in the data set on a given time scale. This conclusion is logically fallacious, since the non-detectability of a trend in a data set does not logically exclude the possibility that the trend is only masked by noise on the time range of the analysis and only detectable when the time range is increased.

The speaker's asserted conclusion, it was incontrovertible that global warming "has stopped" after the year 2000 is scientifically not valid, since it is based on a methodologically flawed analysis.

And that conclusion is important. More than 80% of anthropogenic GHG emissions were after 1940. There was no discernible rise in global temperature from 1940 until ~1970. And the rise from 1910 to 1940 is the same as the rise from 1970 to 2000 when it stopped. This indicates that there is no discernible effect of the anthropogenic GHG emissions on global temperature.

The speaker's repeated assertion the global temperature increase before 1940 despite the fact that most of the CO2 emission has occurred after 1940, and the absence of a discernible temperature increase between 1940 to 1970 despite increasing CO2 concentration in the atmosphere were in contradiction to the explanation that increasing CO2 concentration in the atmosphere causes global warming is also false. There is no contradiction here between empirical data and physical explanation given by mainstream climate science. There would be a contradiction, if a linear relationship between CO2 and observed temperature was claimed, and if it was claimed CO2 was the only climate driver that could cause changes in the temperature. No serious climate scientist says such a thing. The temperature record is the result of a combination of forcings from various climate drivers, e.g., greenhouse gases, aerosols, solar activity, land use, plus internal variability in the system. Thus, the speaker's argument is just a straw man argument, which he has repeatedly applied.

Monday, August 20, 2012

What got me snipped from wattsupwiththat.com - 2

This time two comments have been vanished from the thread "July was also the 329th consecutive month of positive upwards adjustment to the U.S. temperature record by NOAA/NCDC" at WUWT, either before posting or by deletion after my comment had already been appeared in the thread. Both comments were in reply to comments made by user "Smokey". I don't know why they were vanished. Perhaps, one of the WUWT moderators (e.g., dbs - David B Stealey, h/t Rob Decker) felt my replies may have exposed Smokey's suggestions coming with his comments as embarrassing nonsense.

The first of my comments that got vanished was in reply to a graph posted by Smokey, which he described as the global satellite record of temperature measurements:

----- snip -----

Smokey writes:

USHCN is only the U.S. ["adjusted"] data. But the central question concerns global warming. So let’s look at the global satellite record, which is by far the most accurate temperature measurement.

and gives us following link to look at:

ftp://ftp.ssmi.com/msu/graphics/tls/plots/rss_ts_channel_tls_global_land_and_sea_v03_3.png

I suppose Smokey shows us this temperature record, which has been derived from satellite retrievals of radiation data by applying mathematical algorithms with assumptions (since satellites do not measure temperatures) to assert that the global temperature has been decreasing over the satellite period.

Smokey is right. There is a negative temperature trend in the lower stratosphere over the whole satellite period. The graph he shows is for the lower stratosphere. The observed temperature change in the lower stratosphere has happened in parallel to the statistically significant positive temperature trend in the troposphere and at the surface over the same time period. The graph shown by Smokey is empirical data, which are consistent with the global warming at the surface and in the troposphere and show what has been predicted. Global warming in the troposphere comes with lower stratospheric cooling. That is the prediction. The data are in agreement with the physical explanation, which attributes those trends to the increasing concentration of greenhouse gases in Earth's atmosphere.

Thank you for showing this, Smokey.

----- snip -----


The second snipped reply was to a comment by Smokey, where he showed a figure with a temperature trend:

----- snip -----

Smokey wrote at August 19, 2012 at 8:52 pm:

Some folks didn’t like my previous chart. So they will probably hate this one.,

referring following link: http://www.friendsofscience.org/assets/documents/FOS%20Essay/HadCrut3Global.jpg

Yes, this is totally destroying “the global warming hoax”, isn’t it. /sarc

What about following one?

http://www.skepticalscience.com/graphics.php?g=47

----- snip -----